Dashboard#
The Grafana dashboard provides an overview of the system’s performance and metrics in real-time. It is a powerful tool for visualising data streams and monitoring the system’s health. The dashboard is accessible through a web interface and can be customised to display different metrics and data streams.
Getting Started#
To get started with the Grafana dashboard, follow these steps:
Navigate to the Grafana dashboard by opening a web browser and entering the following URL:
Direct access:
http://localhost:3000
Log in to the Grafana dashboard using the credentials from your
.envfile (GF_SECURITY_ADMIN_USERandGF_SECURITY_ADMIN_PASSWORD).A new connection is needed to the TimescaleDB database to visualise the data streams. To do this, follow these steps:
Click on
Connectionsin the left sidebar.Click on
Add new connection.Select
PostgreSQLfrom the list of available data sources.Add new data source
Host url:
timescaledb:5432Database name:
leafAuthentication username:
readonly_user(recommended for viewing) orpostgres(for admin)Authentication password: Check the
.envfile forREADONLY_PASSWORDorPGPASSWORDTLS/SSL Mode:
disableClick on Save & Test
Database Connection OKshould be shownNext, you can start to visualize data by building a dashboard, or by querying data in the Explore view.
Network Configuration#
Grafana operates exclusively on the frontend network for user access:
Frontend Network: Web interface access for users
Port: 3000 for the Grafana web interface
Resource Limits: 512MB memory, 0.5 CPU cores
Health Checks: Automated monitoring of Grafana service health
The Grafana service connects to TimescaleDB through the backend network, ensuring secure internal communication while providing user access through the frontend network.
Go to the
Dashboardssection in the left sidebar to create a new dashboard.Click on New > New dashboard
Add visualization
Select the data source you just created
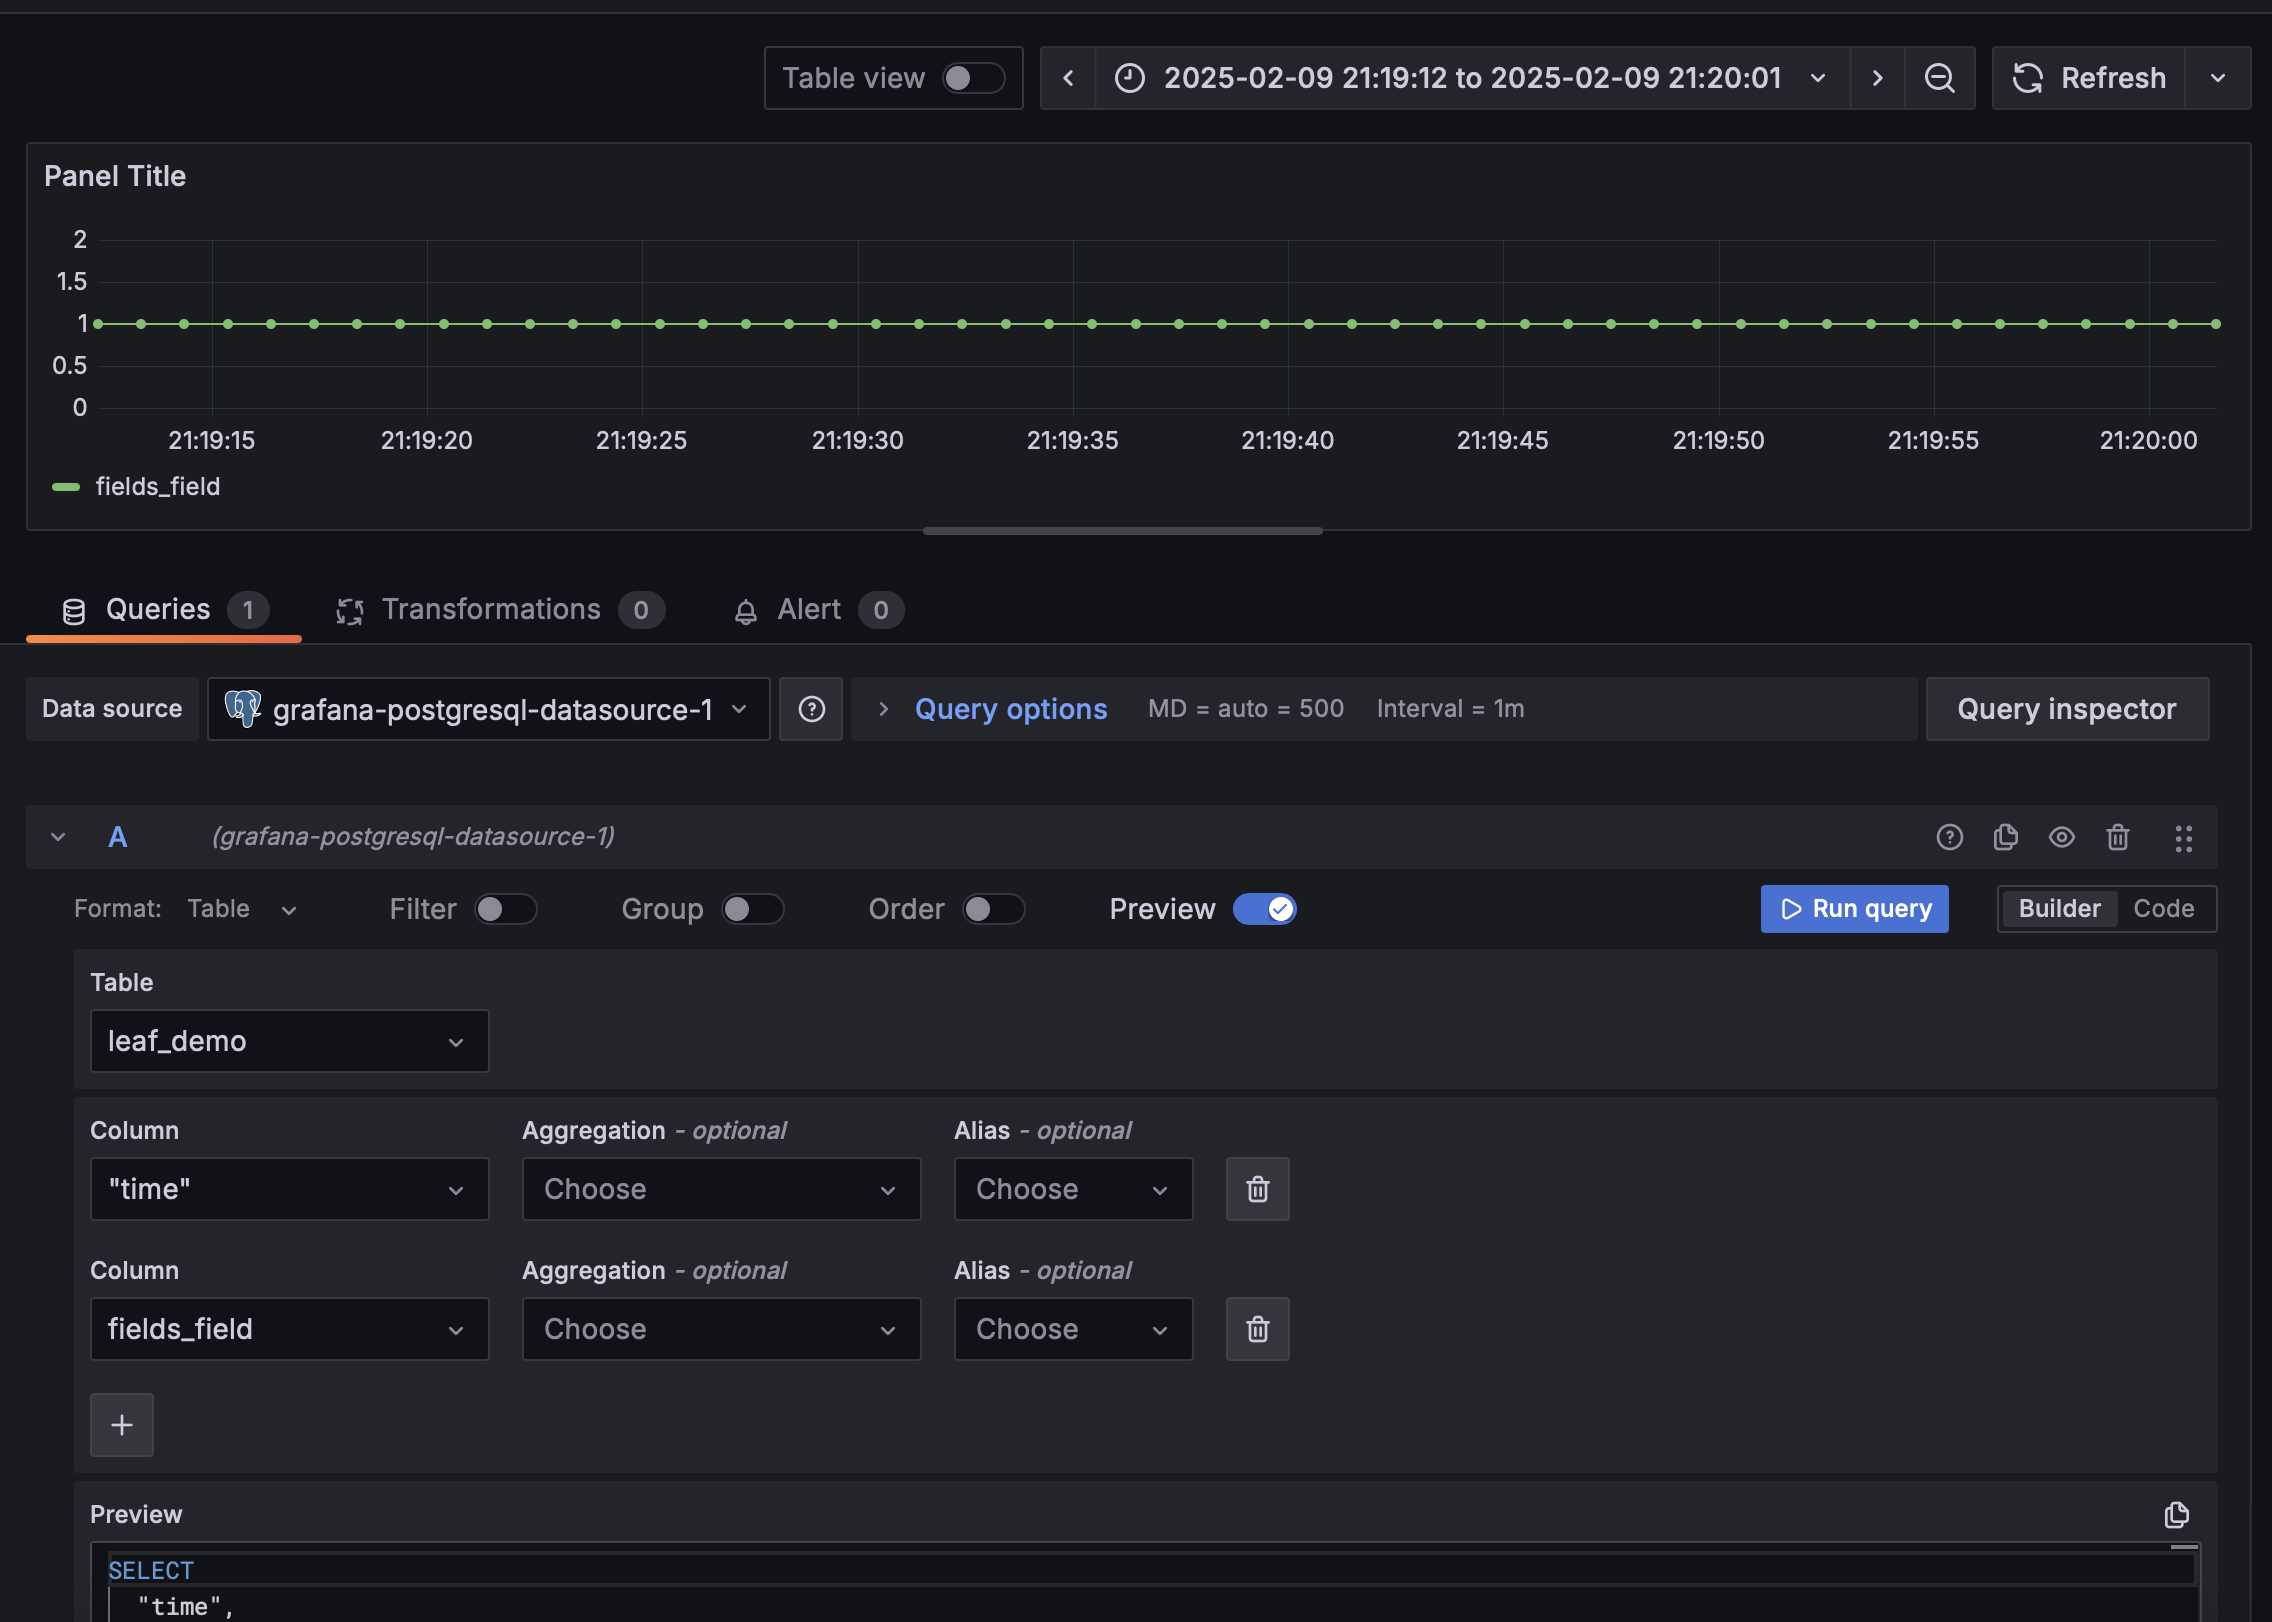
The query builder can help you to create queries to fetch data from the database.
Save dashboard
You should now have a panel in the dashboard with the demo information in place.
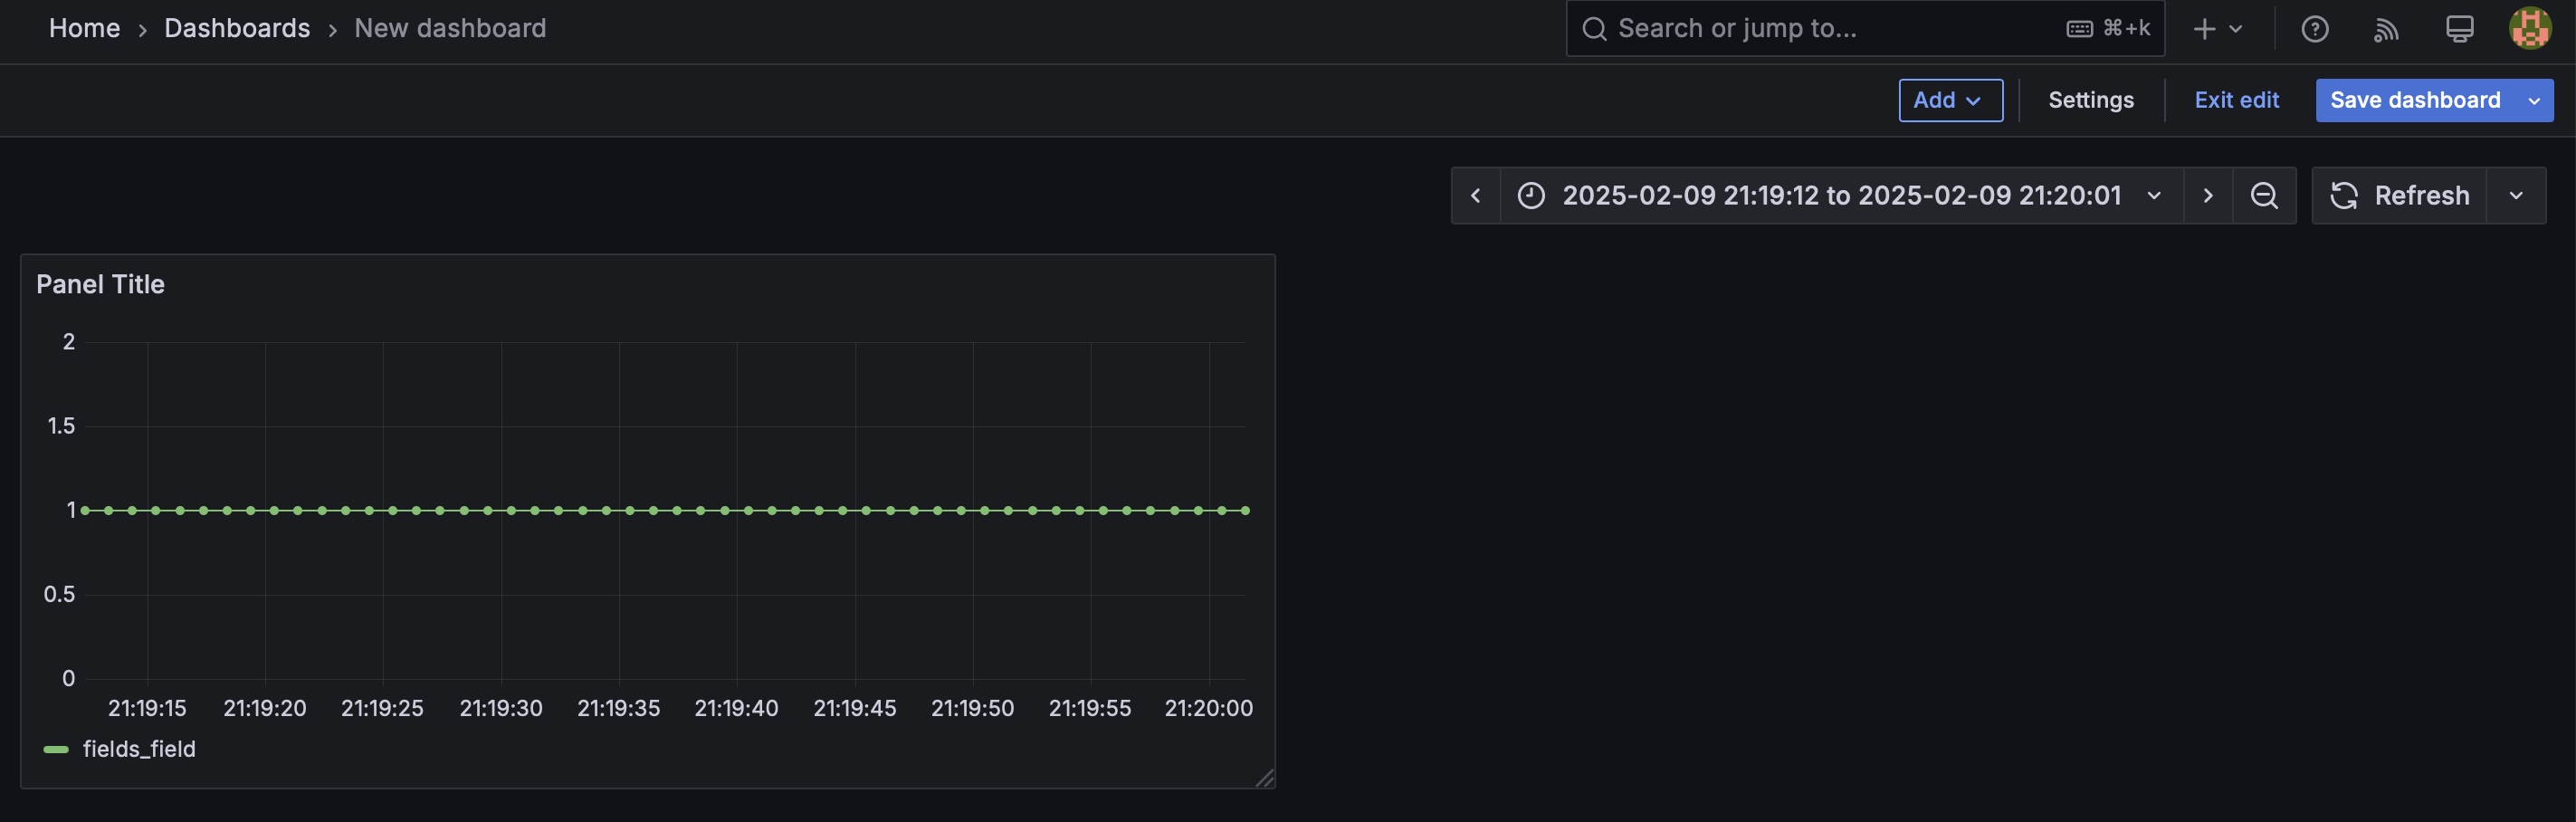 Overview of the Grafana dashboard with demo data.