Data#
Data Format#
LEAF converts measurement data into Influx timeseries databases (InfluxDB) Line Protocol data format by default, meaning that the data can be easily inserted into InfluxDB or any other timeseries database.
InfluxDB Line Protocol#
Line protocol is a text based data model format that is designed for efficiently writing time-series data. This data model organizes timeseries data and data points into four components:
measurement: The identity of the measurement set and referring to the table that data is stored in. Note that later InfluxDB versions refer to this astable.tagsets: Optional key-value pair(s) that can be used as, or hold, the metadata to describe the data.fieldsets: Key-value pair(s) representing the data and its value (e.g.,temperature=10)timestamp: Optional unix timestamp
Format#
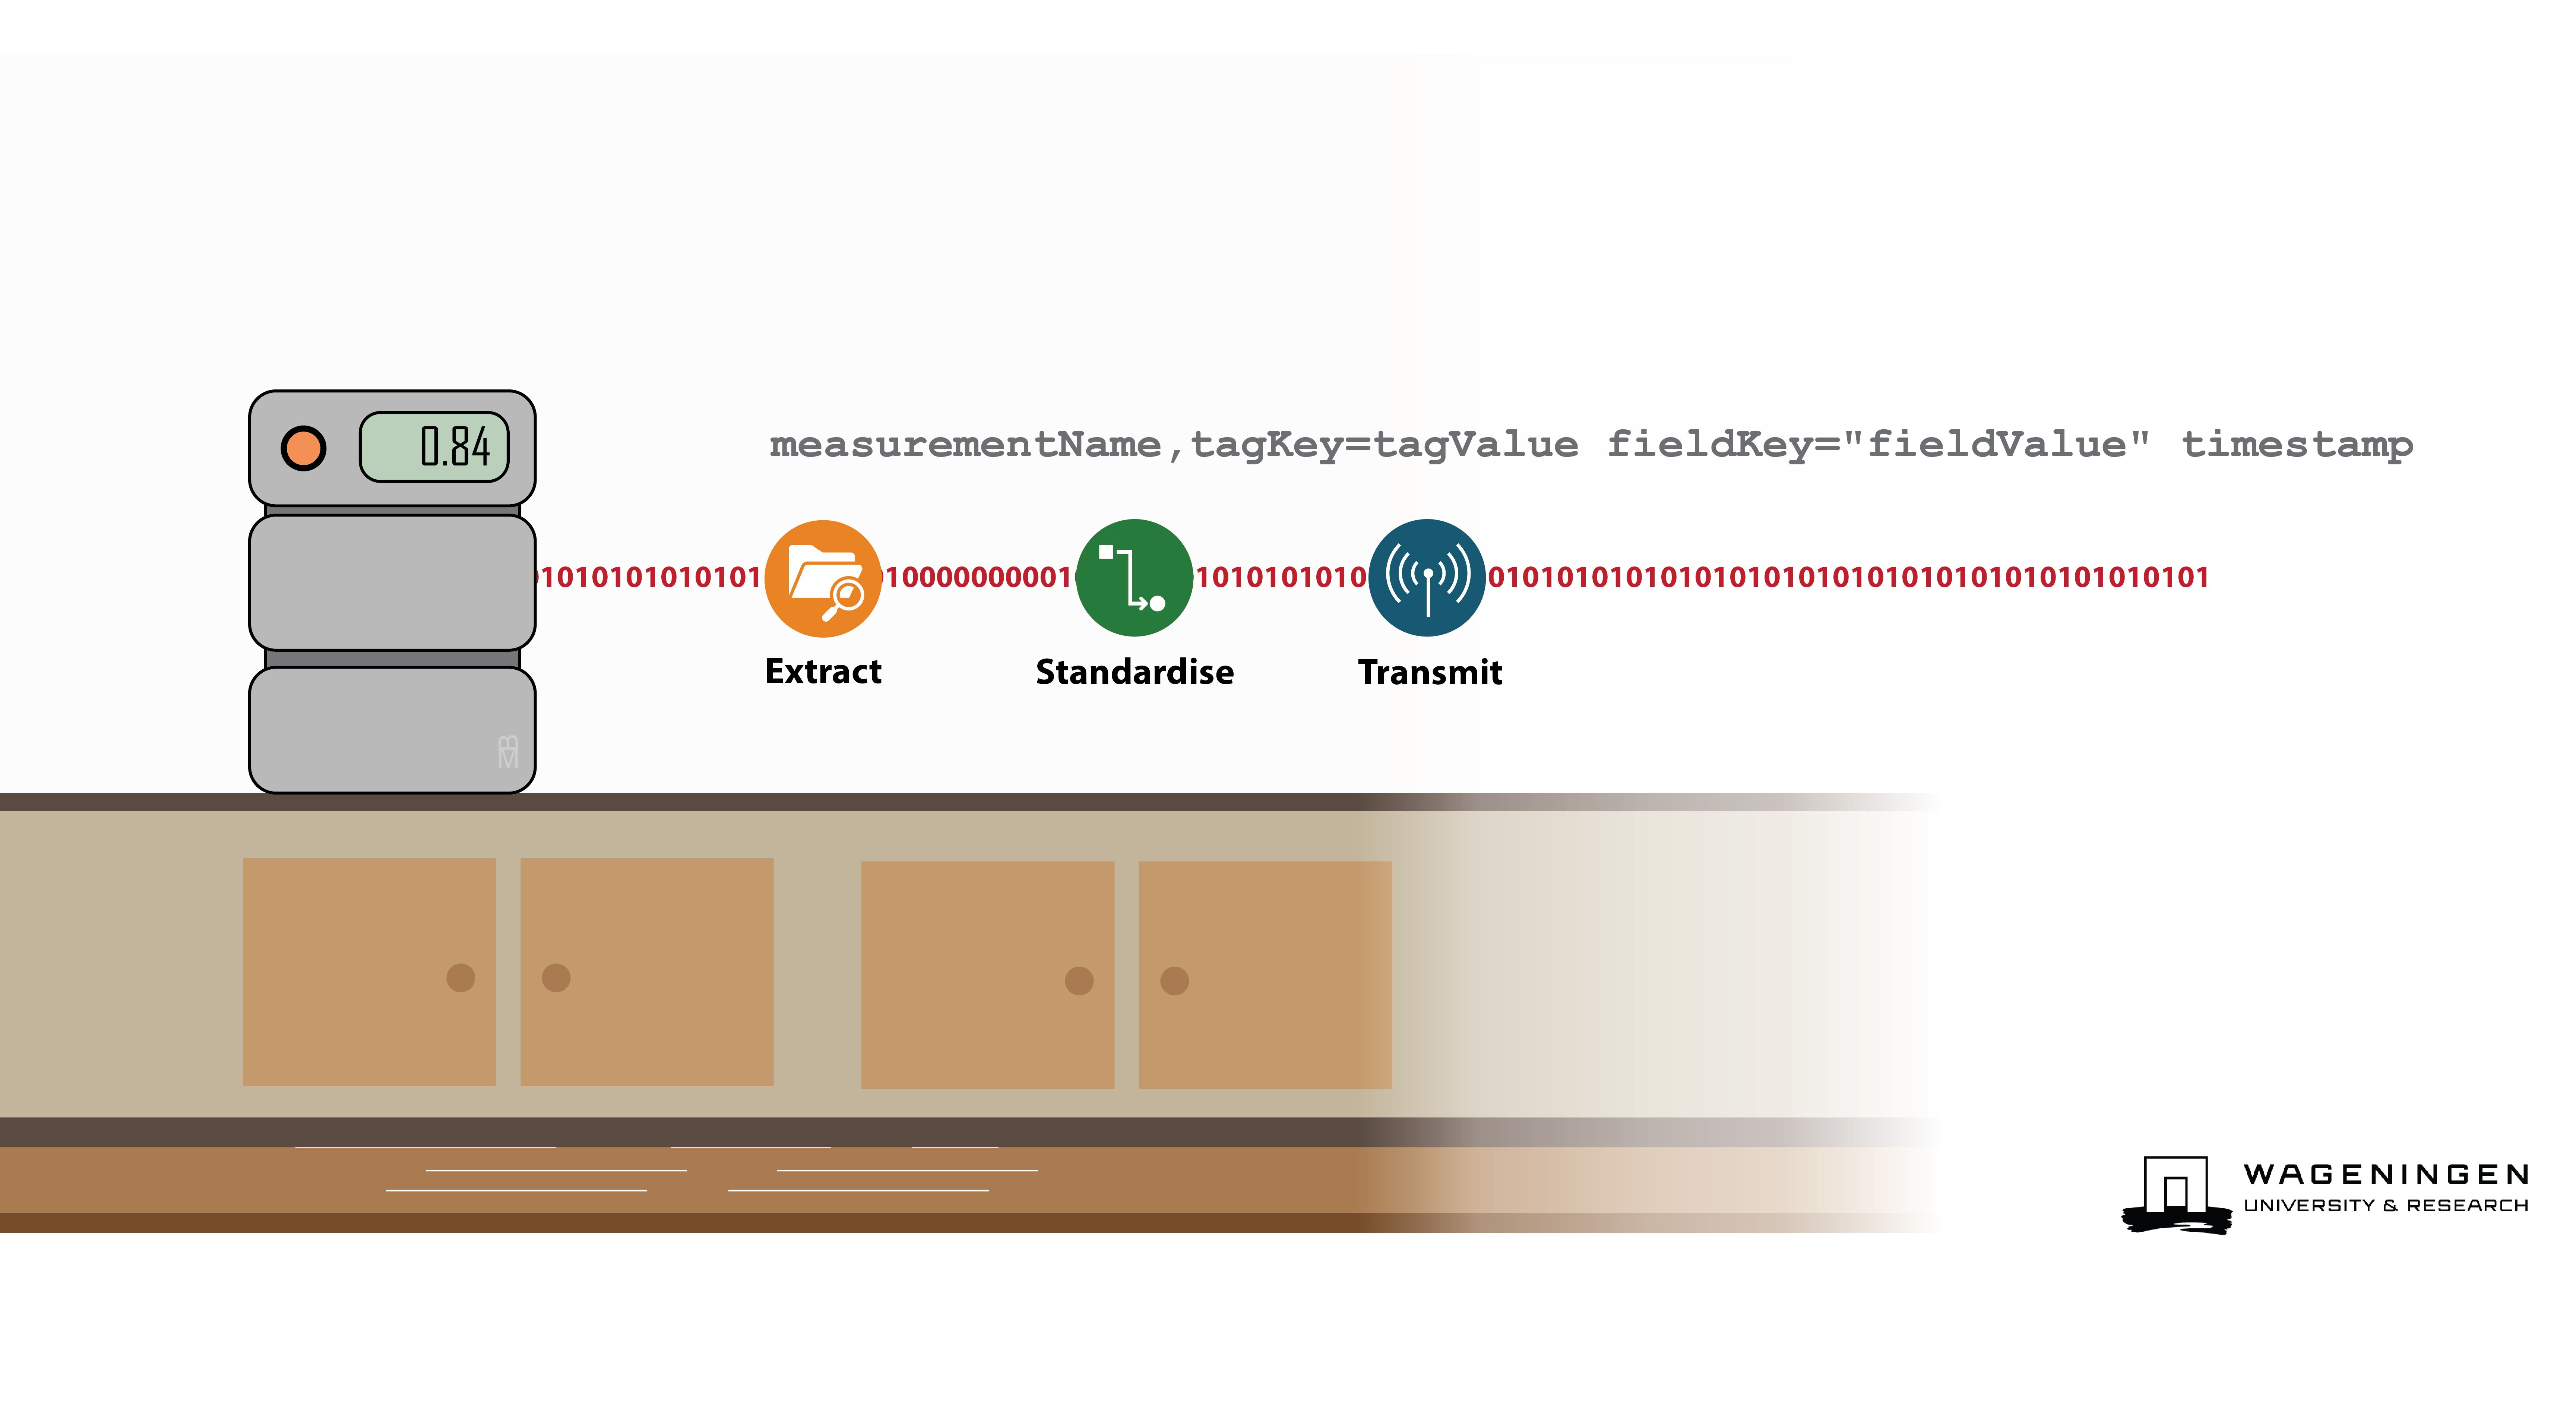
These four components: timestamps;, measurement names; fields (key-value pairs representing the data); and tags (optional key-value pairs used to store metadata that describes the data) are arranged in a single line. A typical line in this format looks like this:
measurementName,tagKey=tagValue fieldKey="fieldValue" 1465839830100400200
Where:
measurementName: Identifies the
measurement.tagKey=tagValue: Zero or more
tagsets separated by commas. Tags are optional but recommended for indexing.fieldKey=”fieldValue”: At least one
fieldset, with multiple fields separated by commas. Fields are the actual data points.1465839830100400200: An optional
timestampfor the data point. If not specified, depending upon the recipient, the server’s current time is used.
measurementName,tagKey1=tagValue1,tagKey2=tagValue2 fieldKey1="fieldValue1",fieldKey2="fieldValue2" 1465839830100400200
This format is highly optimized for time-series data, enabling quick parsing and writing as:
everything before the first comma is a
measurementeverything between the first comma and the first white space is
tag, with distincttagbeing separated by a commaeverything between the first white space and the second white space is
field, with distinctfieldbeing separated by a commaeverything after the second comma is
timestamprepresented as an integer
Each line is then separated by \n.
Example#
Example 1: Abundance#
As an example, say if we have a timeseries dataset where we count the occurrence (or abundance) of two species (G. ruber and G. bulloides) this would be represented tabularly as:
AbundanceCounts
Time |
Sample |
Location |
Analyst |
Abundance: G. ruber |
Abundance: G. bulloides |
|---|---|---|---|---|---|
1465839830100400200 |
T86_5P#6_DIS_0_1cm |
NAtl |
BM |
50 |
76 |
1465839830100400800 |
T86_5P#6_DIS_1_2cm |
NAtl |
JK |
47 |
81 |
1465839830100401200 |
T86_5P#6_DIS_2_3cm |
NAtl |
JK |
31 |
99 |
With the data (Abundance: G. ruber and Abundance: G. bulloides) and metadata (Sample, Location, Analyst) being found on individual
rows with a timestamp index (Time). In line protocol this table would be:
AbundanceCounts,sample=T86_5P#6_DIS_0_1cm,location=NAtl,analyst=BM G_ruber=50,G_bulloides=76 1465839830100400200
AbundanceCounts,sample=T86_5P#6_DIS_1_2cm,location=NAtl,analyst=JK G_ruber=47,G_bulloides=81 1465839830100400800
AbundanceCounts,sample=T86_5P#6_DIS_2_3cm,location=NAtl,analyst=BM G_ruber=31,G_bulloides=99 1465839830100401200
To make cleaner we could make it one message per analysis:
AbundanceCounts,sample=T86_5P#6_DIS_0_1cm,location=NAtl,analyst=BM G_ruber=50 1465839830100400200
AbundanceCounts,sample=T86_5P#6_DIS_0_1cm,location=NAtl,analyst=BM G_bulloides=76 1465839830100400200
AbundanceCounts,sample=T86_5P#6_DIS_1_2cm,location=NAtl,analyst=JK G_ruber=47 1465839830100400800
AbundanceCounts,sample=T86_5P#6_DIS_1_2cm,location=NAtl,analyst=JK G_bulloides=81 1465839830100400800
AbundanceCounts,sample=T86_5P#6_DIS_2_3cm,location=NAtl,analyst=BM G_ruber=31 1465839830100401200
AbundanceCounts,sample=T86_5P#6_DIS_2_3cm,location=NAtl,analyst=BM G_bulloides=99 1465839830100401200
To further simplify the line protocol and make it less dependent upon specific field keys we could add the species being counted as a separate field:
AbundanceCounts,sample=T86_5P#6_DIS_0_1cm,location=NAtl,analyst=BM counted=G_ruber,count=50 1465839830100400200
AbundanceCounts,sample=T86_5P#6_DIS_0_1cm,location=NAtl,analyst=BM counted=G_bulloides,count=76 1465839830100400200
AbundanceCounts,sample=T86_5P#6_DIS_1_2cm,location=NAtl,analyst=JK counted=G_ruber,count=47 1465839830100400800
AbundanceCounts,sample=T86_5P#6_DIS_1_2cm,location=NAtl,analyst=JK counted=G_bulloides,count=81 1465839830100400800
AbundanceCounts,sample=T86_5P#6_DIS_2_3cm,location=NAtl,analyst=BM counted=G_ruber,count=31 1465839830100401200
AbundanceCounts,sample=T86_5P#6_DIS_2_3cm,location=NAtl,analyst=BM counted=G_bulloides,count=99 1465839830100401200
By making the line protocol more generic additional datasets could be stored alongside this one from different locations, analysts, or even samples.
Example 2: Environmental variables#
A timeseries database of a sensor that measures rainfall and temperature would for example look like the following table:
EnvironmentalVariables
Time |
Location |
Entity |
Rainfall |
Temperature |
|---|---|---|---|---|
1465839830100400200 |
WUR Campus |
Sensor1 |
0 |
22.4 |
1465839830100400800 |
WUR Campus |
Sensor1 |
0 |
21.7 |
1465839830100401200 |
WUR Campus |
Sensor1 |
0 |
21.9 |
This could be translated into:
EnvironmentalVariables,location="WUR Campus",entity=Sensor1 measurement=temperature,value=22.4 1465839830100400200
EnvironmentalVariables,location="WUR Campus",entity=Sensor1 measurement=rainfall,value=0 1465839830100400200
EnvironmentalVariables,location="WUR Campus",entity=Sensor1 measurement=temperature,value=21.7 1465839830100400800
EnvironmentalVariables,location="WUR Campus",entity=Sensor1 measurement=rainfall,value=0 1465839830100400800
EnvironmentalVariables,location="WUR Campus",entity=Sensor1 measurement=temperature,value=21.9 1465839830100401200
EnvironmentalVariables,location="WUR Campus",entity=Sensor1 measurement=rainfall,value=0 1465839830100401200
Python Package: InfluxObject#
To convert datasets into Line Protocol, LEAF uses the Python Package InfluxObject. This package can be independently installed by entering the following command in the terminal:
pip install influxobject
The package contains the following commands:
x = influxobject.InfluxPoint()
x.
    x.add_field(..., ...)
    x.from_json(...)
    x.remove_field(...)
    x.set_measurement(...)
    x.to_line_protocol()
    x.add_tag(..., ...)
    x.remove_tag(...)
    x.set_tags(...)
    x.validate()
    x.parse_line_protocol(...)
    x.set_fields(...)
    x.set_timestamp(...)
    x.to_json()
which can be used like so:
from influxobject.influxpoint import InfluxPoint

influx_point = InfluxPoint()
influx_point.set_measurement("measurement")
influx_point.set_tags({"tag1": "value1"})
influx_point.set_fields({"field1": 1, "field2": 2})
influx_point.set_timestamp(datetime.datetime(2021, 1, 1))\

# JSON and Line Protocol outputs
print(influx_point.to_json())
print(influx_point.to_line_protocol())
JSON representation:
{
    "measurement": "measurement",
    "tags": {"tag1": "value1"},
    "fields": {"field1": 1, "field2": 2},
    "timestamp": 1609455600,
}
Line Protocol representation:
"measurement,tag1=value1 field1=1,field2=2 1609455600"