Data Explorer & Plots#
The Data section provides two views for inspecting sensor data: a tabular explorer and a time-series plot view. Both are scoped to the access grants of the logged-in user.
Data Explorer#
URL: /data/explorer
The explorer lets you query raw sensor data with filters and download the results.
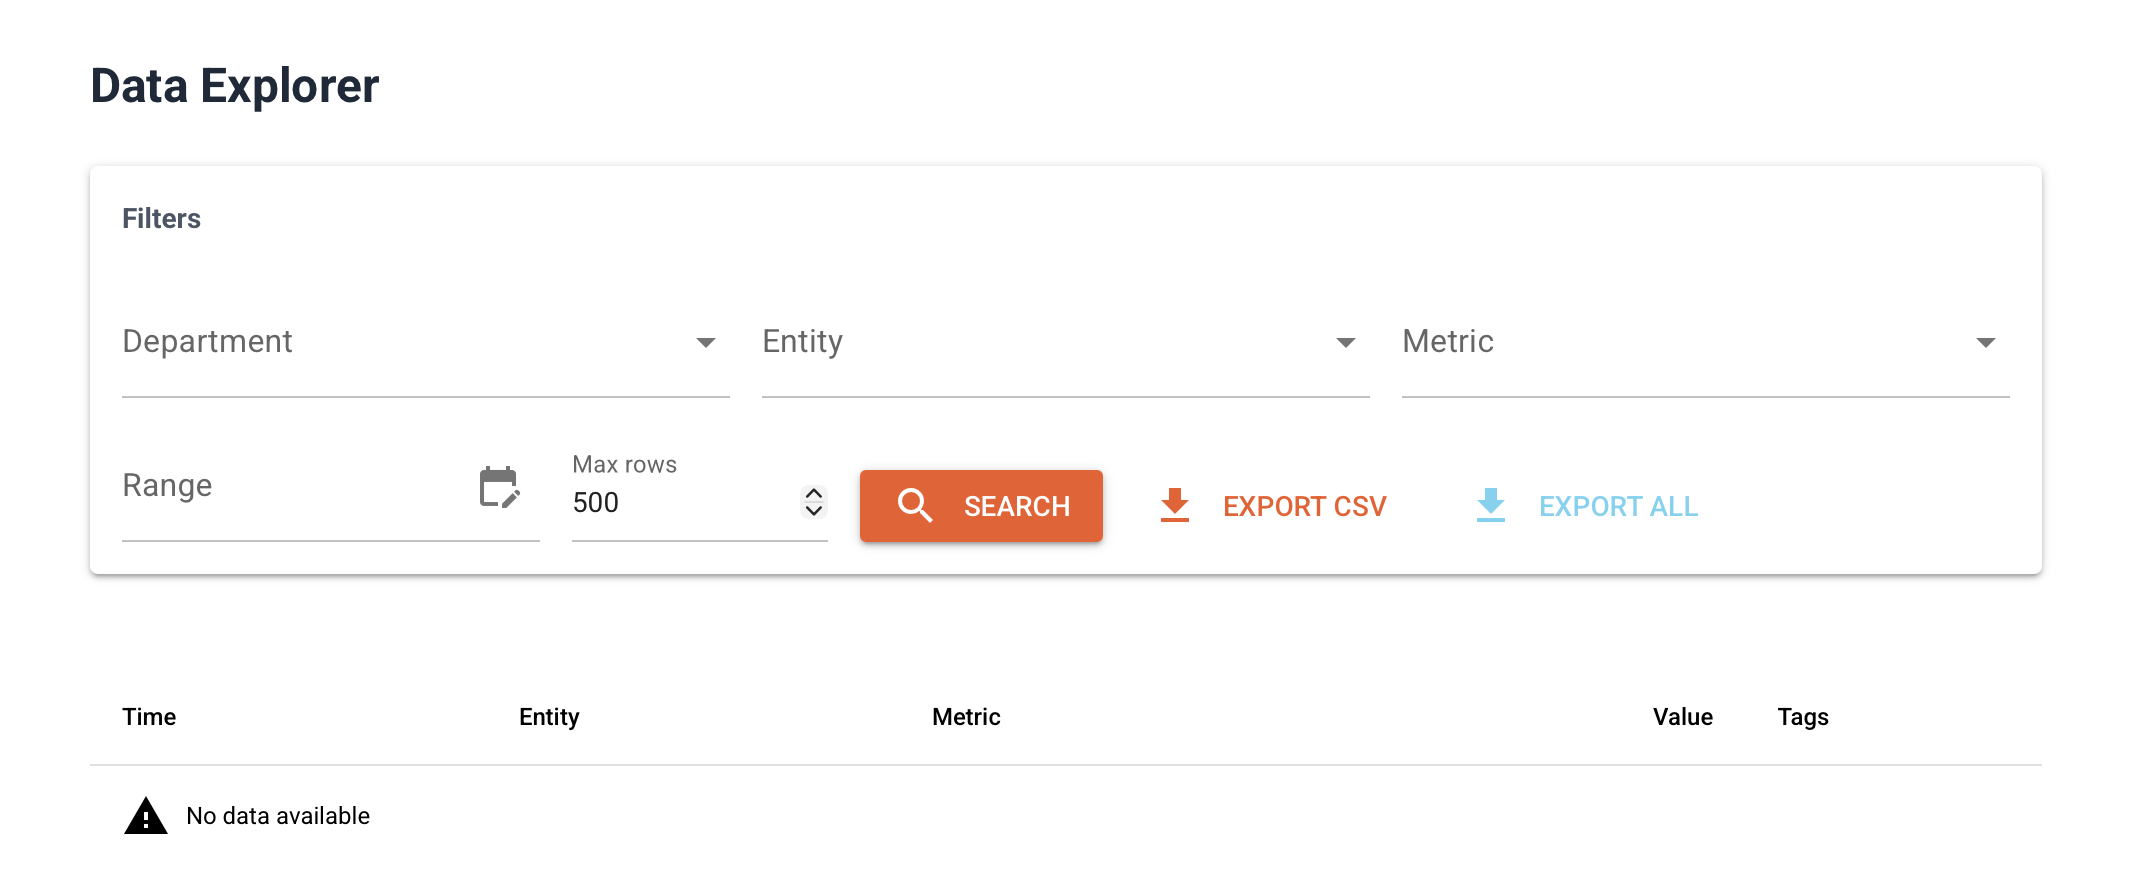
Filtering data#
Use the filter panel to narrow your query:
Filter |
Description |
|---|---|
Organisation |
Select the organisation |
Department |
Select a department within the organisation |
Entity |
Filter to a specific sensor or device (optional) |
Metric |
Filter to a specific metric (optional) |
From |
Start of the time range |
To |
End of the time range |
Limit |
Maximum number of rows to return (default 1000) |
Click Query to load the data. Results are shown in a table with columns for time, entity, metric, value, and tags.
Downloading data#
Click Download CSV to export the current query results as a comma-separated file.
Plots#
URL: /data/plots
The plots view renders interactive time-series charts for one or more metrics.
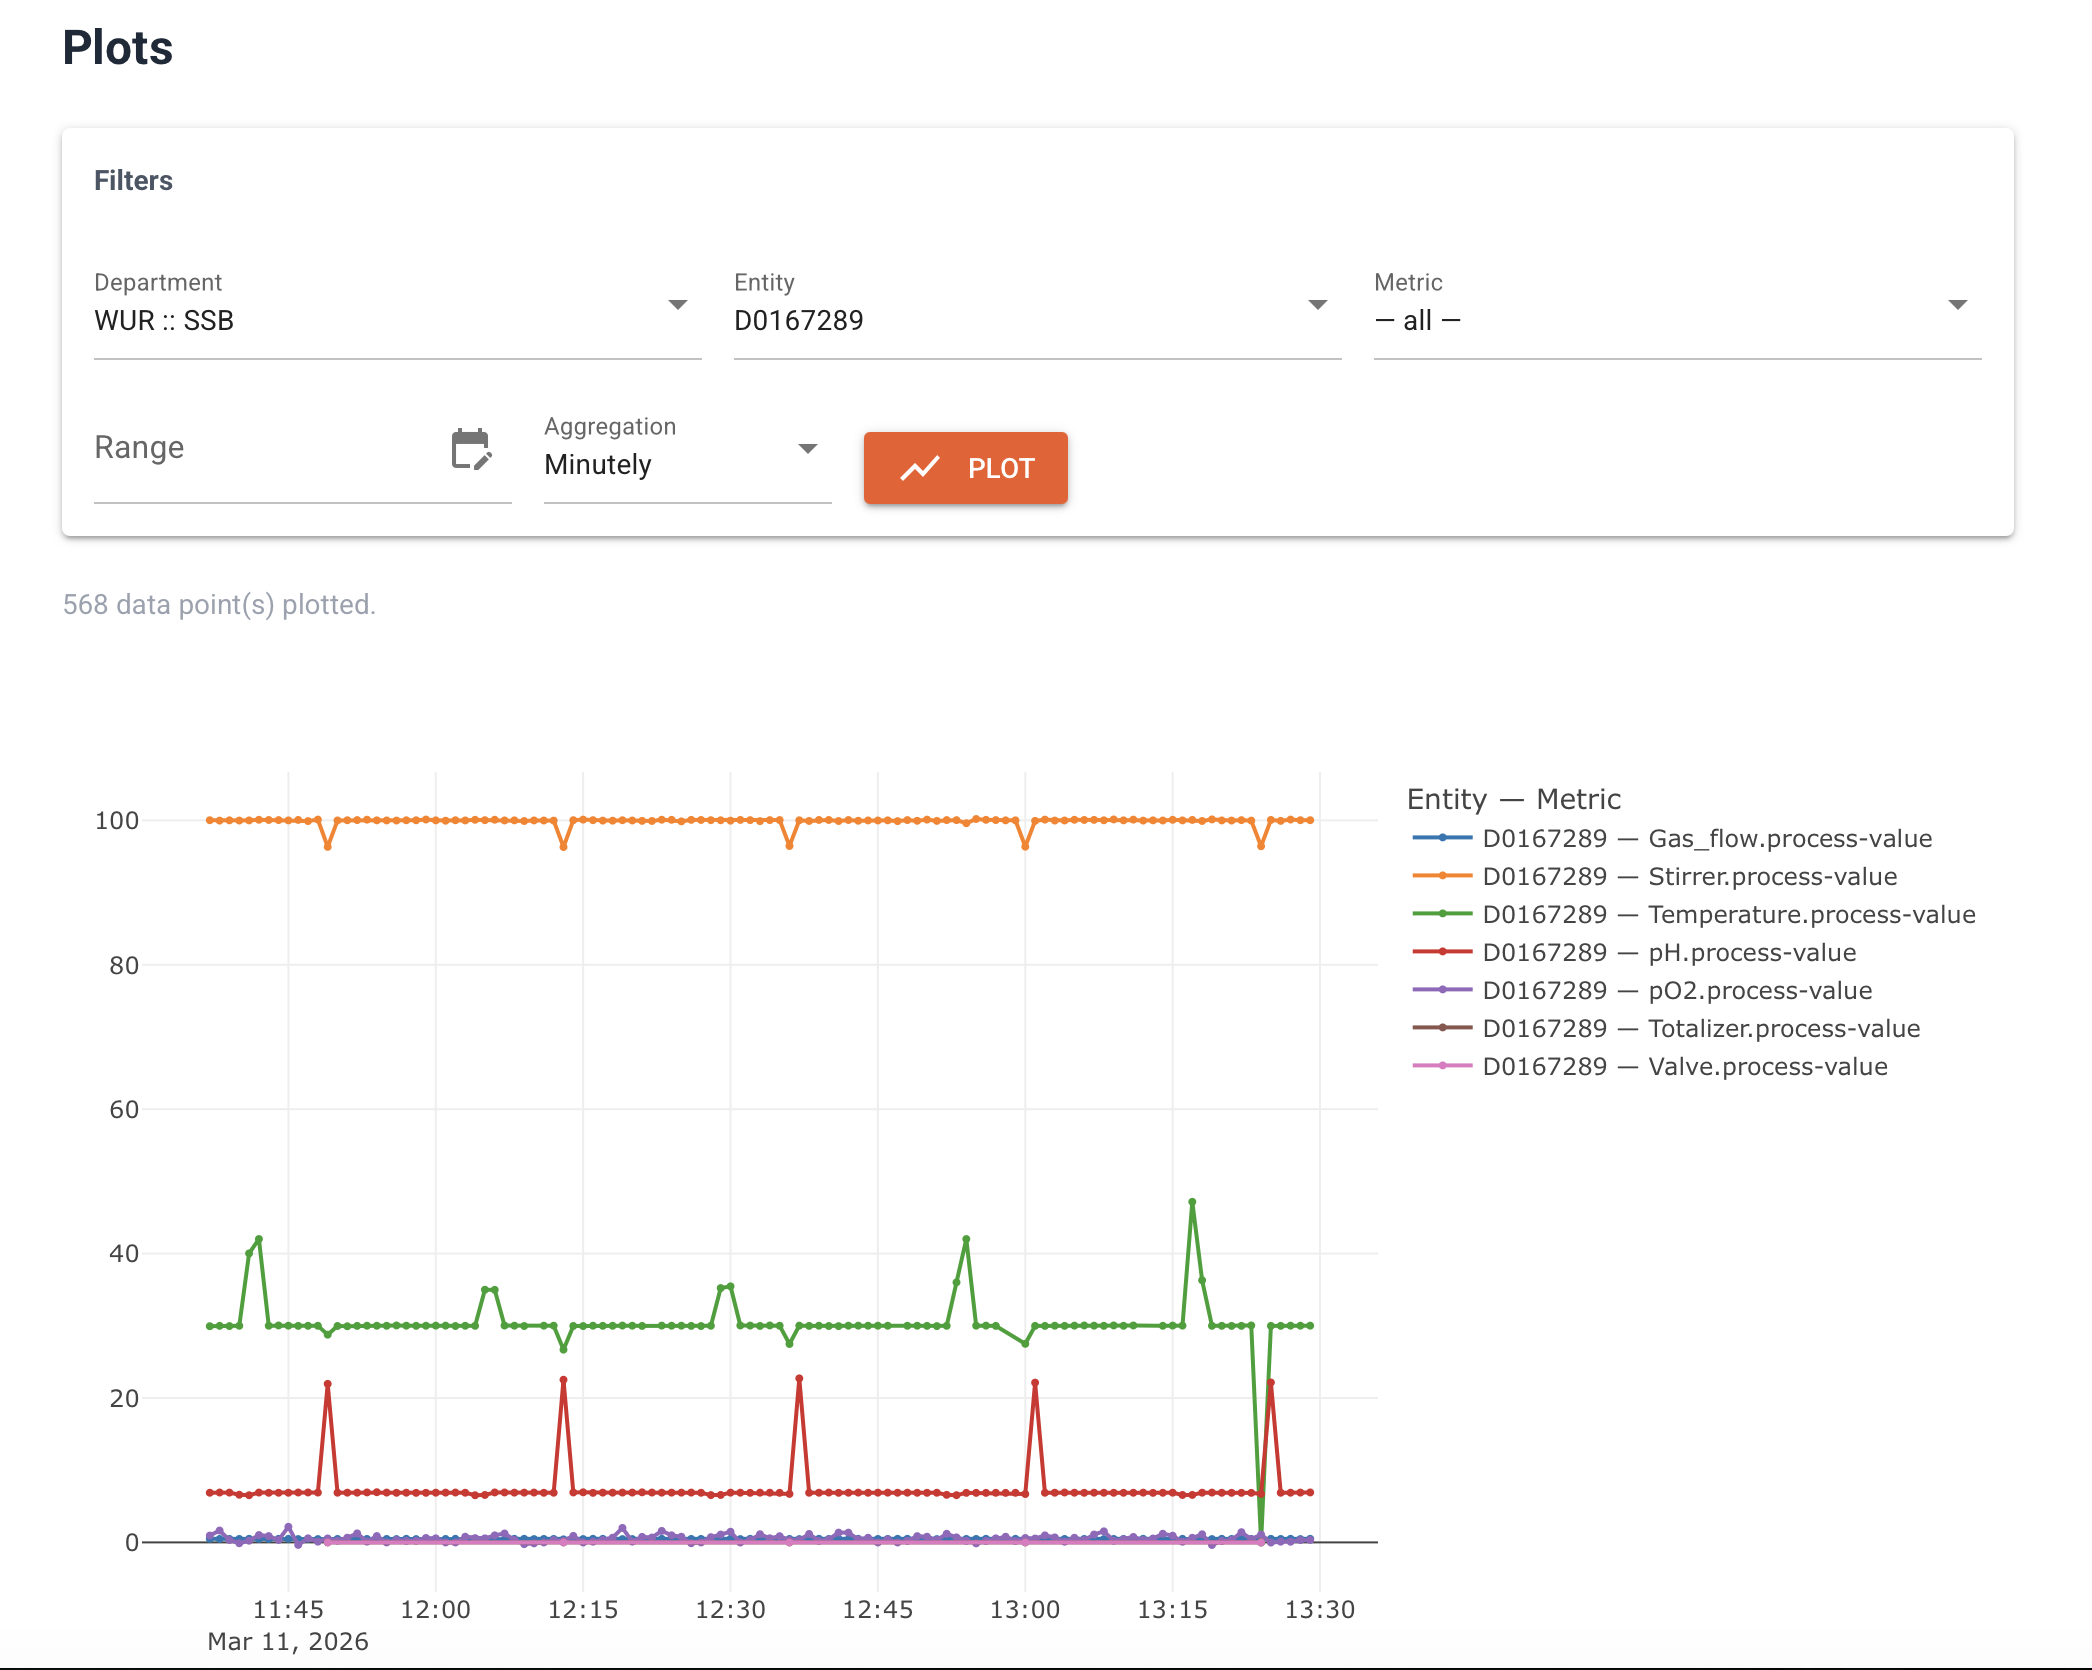
Creating a plot#
Select an organisation and department.
Select one or more entities.
Select one or more metrics.
Set the time range.
Click Plot.
Each metric is drawn as a separate line. Multiple entities for the same metric are shown on the same axis.
Interacting with the chart#
Zoom: click and drag on the chart area to zoom into a time range.
Pan: hold shift and drag.
Reset: double-click to reset the view.
Hover: hover over a data point to see the exact value and timestamp.
The plots view is suitable for quick visual inspection. For production dashboards and alerting, use Grafana.